This page is a sub-page of our page on Potential Projects.
///////
Related KMR web sites:
///////
Goal:
Increased throughput through difficulty mapping
and didactic bottleneck interventions
Method: Help the individual student to:
A. Identify what the student does not know (out of what the student should have known) before (through “backward knowledge gap mapping“) and (through both f2f meetings and online meetings) suggest customized interactive “recapitulation exercises”.
B. Identify what feels difficult or impossible for the student during the current course and/or the completed non-approved course, and suggest means to help the student pass the test for the course next time.
Process: Enhanced storytelling through interactivation and knowledge aggregation.
A: Mapping:
• What is already missing? Diagnostic tests can show backward knowledge gaps.
• Which sections are the most difficult to pass (= have the most failures on the test)?
• How do we teach these difficult sections?
• What material is used?
• How are the difficult concepts related to each other in different courses?
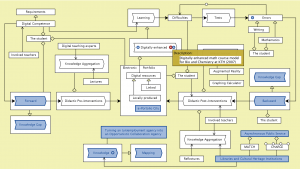
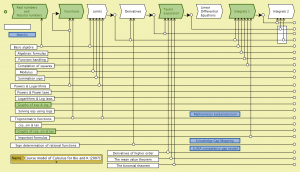
(See course model of Calculus I for Bio and Chemistry at KTH below)
B: Didactic post-interventions:
1. Improvement of the problematic material through “reflectures” that can explain the difficult concepts and link to effective explanations in various web-based learning environments such as YouTube.
2. Knowledge aggregation, i.e., recording, post-enhancing and linking to instructive learning experiences is of crucial importance here in order to improve the material.
3. Interactivation of problematic relationships between text and figures: A well-known problematic element in the study of mathematics is the traditional (and sometimes very “reader-unfriendly”) relationship between the figures (= the graphic illustrations) and the flowing text in a typical textbook. The explanatory figure, which often illustrates some form of dynamic connection or process, is not only fixed and static but is often also located on a different page in the book in relation to the descriptive text. This leads to a constant flipping back and forth in the book when one tries to follow the reasoning in the text around the different elements depicted in the figure.
By applying overlay technology from so-called augmented reality, the figures can be linked to interactive programs that “breathe life” into the formulas. Interactive mathematics programs such as the Graphing Calculator enable experience-based cognitive feedback loops with great learning potential and insight. In collaboration with, for example, the CL/TL programs, Math Coach, ARC and RCN, the library can offer a personalized interaction service on problematic figures – as well as on other problematic sections in the course literature.
///////
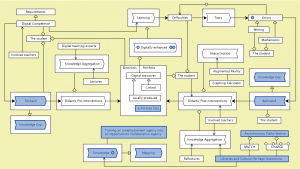
Digitally enhanced learning driven by forward and backward knowledge gaps:
///////
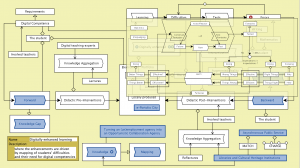
Digitally enhanced learning – peeking into The Learn-Err model:
///////
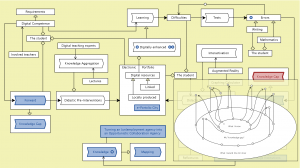
Digitally enhanced learning – peeking into the Knowledge Gap Mapping model:
///////
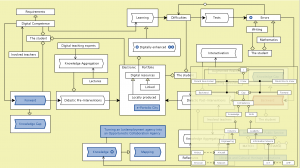
Digitally enhanced learning – peeking into the LUISA Knowledge Gap model:
///////
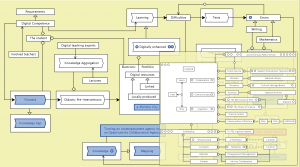
Digitally enhanced learning – peeking into the Asynchronous Public Service model:
///////
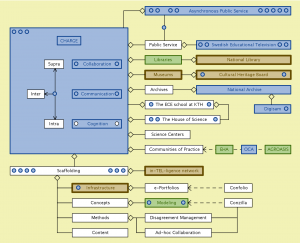
The Asynchronous Public Service model:
///////
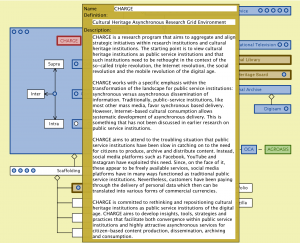
Asynchronous Public Service – info – CHARGE:
///////
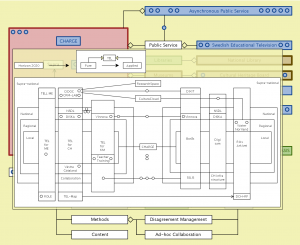
Asynchronous Public Service – peeking into the KTH strategy for Horizon 2020 model:
///////
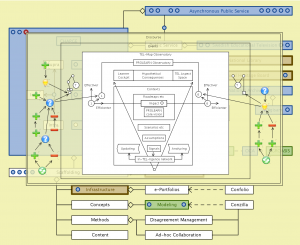
Asynchronous Public Service – peeking into the TEL-Map Observatory model:
///////
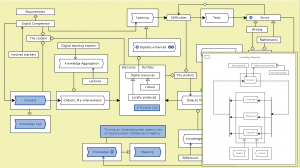
Digitally enhanced learning – peeking into the Libraries and Cultural Heritage Institutions Knowledge Mapping model:
///////
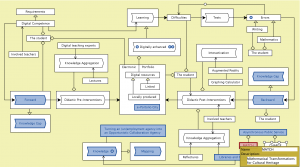
Digitally enhanced learning – info – the MATCH model:
///////
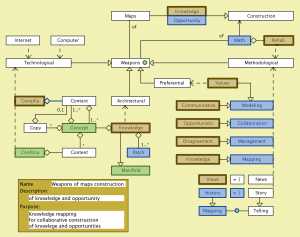
Digitally enhanced learning – peeking into the Weapons of Maps Construction model:
///////
///////
Digitally enhanced learning – peeking into the Knowledge Negotiations model:
///////
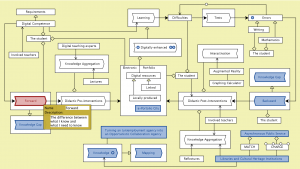
Digitally enhanced learning – info – Forward Knowledge Gap:
///////
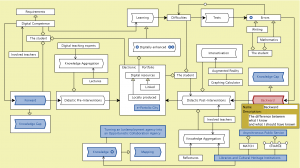
Digitally enhanced learning – info – Backward Knowledge Gap:
///////
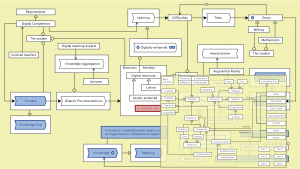
Digitally enhanced learning – peeking into the e-Portfolio City model:
///////
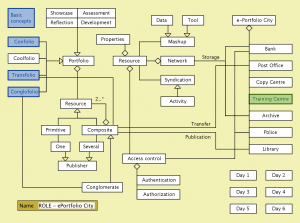
The e-Portfolio City model (ROLE 2009-2013):
///////
Digitally enhanced learning – info – the Calculus process model
for Bio and Chemistry at KTH:
///////
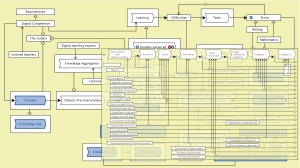
Digitally enhanced learning – peeking into the Calculus process model
for Bio and Chemistry at KTH:
///////
The Calculus process model for Bio and Chemistry at KTH
Gunnar Johnsson and Ambjörn Naeve as part of the Matriks project (2006-2007):
///////
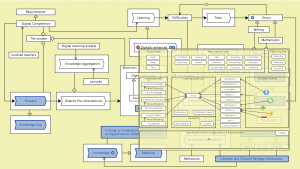
Digitally enhanced learning – peeking into The Learner Cockpit model:
///////
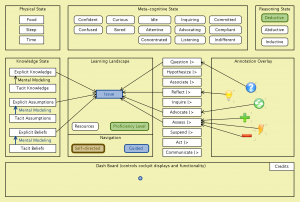
The Learner Cockpit (ROLE 2009-2013):
///////
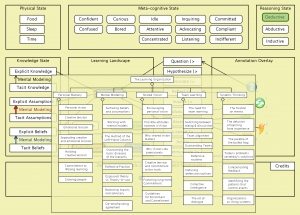
The Learner Cockpit – peeking into The Learning Organization model:
///////
Digitally enhanced learning – peeking into the Knowledge Mapping model
for Libraries and Cultural Heritage Institutions:

///////
• Math Rehab
• What is Mathematics?
• Mathematics is Representation
• Learning Object Repository
///////
• Algebra
///////
• Some basic algebraic concepts
Expected challenges to understanding:
• Relations
• Group, Ring, Field, Module, Vector Space
• Rings of Polynomials
• Disambiguating plus
///////
Expected challenges to understanding:
• Linear Transformations
• Vectors and their Coordinates in different Bases
• Eigenvalues and Eigenvectors
• Diagonalization of Quadrics
///////
• Calculus
///////
• Calculus of One Real Variable
Expected challenges to understanding:
• Taylor Expansion
• The Chain Rule
• Integration
• Fourier Series
///////
• Calculus of Several Real Variables
Expected challenges to understanding:
• Gradients
• Taylor Expansion
• The Chain Rule
• Different Coordinate Systems
///////
• Calculus of One Complex Variable
Expected challenges to understanding:
• Conformal Mapping
• Inversion
• Möbius Transformations
• Steiner Circles (and the Circle of Appollonius)
• Stereographic Projection
///////
• Geometry
• Metric Geometry
• Euclidean Geometry
• Geometric Shapes
///////
Expected challenges to understanding:
• Conics
• Evolutes and Involutes
///////
• Surfaces
Expected challenges to understanding:
///////
